
It is almost impossible to overstate the importance of the internet in transforming every aspect of modern life. The number of internet users continues to grow, and users increasingly expect immediate responses while interacting with web content. Any perceived delay can be off-putting for users and can result in loss of business and revenue for the corporation offering the web service. Thus, optimizing web delivery is an increasingly important challenge. In this article we discuss several modern best-practices to improve web performance. As always, we design a series of experiments to help readers gain hands-on experience in web performance enhancement and better understand the underlying mechanisms. The performance mechanisms discussed here are primarily applicable to the HTTP/1.1 protocol, which is the default web protocol used today.
NOTE: Several readers have requested access to the source code described in these series of articles. We are delighted at this response from our readers, and we will be making all our code available for this article at this link: https://github.com/rprustagi/EL-Web-Performance-I.git. The code and example samples for earlier articles is going to be accessible at https://github.com/rprustagi/Experiential-Learning.git.
As internet and web browser technology has matured, web content has evolved from simple HTML content in the 1990s, to rich graphical content in early 2000s, to the present scenario with interactive multimedia content. As of February 2018, a single webpage access typically downloads about 3.8MB of content [1] , whose complex composition is detailed in Table 1. This complexity is rapidly growing. For instance, in January 2011, a typical page size was 800KB, with just 77 URL requests.
Table 1 : A typical web page (February 2018) [1]
| Sl.No. | Web page component | Value |
|---|---|---|
| 1 | Number of URL requests | 108 |
| 2 | Total transfer size | 3.8MB |
| 3 | Number of HTML requests | 10 |
| 4 | Transfer size of HTML content | 72KB |
| 5 | Number of JavaScript requests | 25 |
| 6 | Transfer size of JavaScript | 508kb |
| 7 | Number of CSS requests | 7.5 |
| 8 | Transfer size of CSS requests | 99kb |
| 9 | Number of images | 55 |
| 10 | Transfer size of images | 1.8MB |
| 11 | Number of fonts requests | 3.3 |
| 12 | Transfer size of fonts | 119kb |
| 13 | Number of TCP connections | 32 |
| 14 | Number of DOM elements | 995 |
| 15 | Number of domains | 20 |
| 16 | Max requests in 1 domain | 52 |
| 17 | Cacheable resources | 51% |
| 18 | Sites using Google API (libraries) | 20% |
| 19 | Sites with custom fonts | 71% |
| 20 | Ratio of compressed responses | 71% |
| 21 | Number of HTTPS requests | 59% |
| 22 | Web pages with errors (4xx, 5xx) | 30% |
| 23 | Web pages with 3xx redirects | 89% |
| 24 | Sites hosting content on CDN | 23% |
The time taken to view a web page in the browser – the Page Load Time1 (PLT) – naturally depends on the user’s internet access speed, but it is crucial to understand that this is not the whole story. In the 1990s, the typical user’s bandwidth was a few Kbps and the PLT for a simple page (typically a single HTML file) was dominated by the time it took to download the file. This was just a function of the file size and the bandwidth – the time taken to render the HTML was negligible. In contrast, many users today have access to bandwidth in excess of 10 Mbps (and more than 100 Mbps in advanced countries), but loading a modern web-page tasks the browser with downloading multiple embedded objects (images, graphics, style sheets, etc.) while managing multiple concurrent TCP connections, laying out the page contents and executing scripts (e.g., JavaScript programs) to make the page interactive. This process is shown in Figure 1, and described in greater detail by Gregorik [2] .
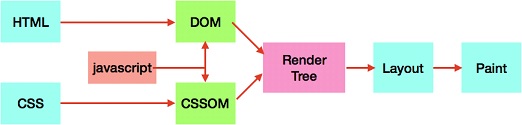
Document rendering requires parsing the HTTP Document Object Model (DOM) as well as the CSS Object Model (CSSOM). However, executing JavaScript can affect this parsing. This impacts the rendering engine, which in turn increases the PLT. Thus, while download times remain important, an increasing fraction of the PLT is the time spent by the browser in preparing the page before users can interact with the downloaded content.
For e-commerce websites, lowering the PLT translates quite directly into increased revenues [3] . A study shows that users react very favorably to web pages that render in less than 100ms, and begin to perceive delays when this rises to between 100ms and 300ms [4] . Users appear willing to accept page rendering times between 300ms to 1s, but they tend to lose focus when this delay is between 1s and 10s. Delays beyond 10s are very likely to lead to cause frustration, page abandonment, and result in users switching to competitor web-sites. Thus, web performance is crucial in meeting business goals, and is an increasingly important metric to measure accurately.
[1] The time until the loading spinner stops spinning in browser
In this article, we will discuss ways to measure web performance, and we will describe a few mechanisms to improve the web performance. The reader must keep in mind that the list of mechanisms discussed here are by no means exhaustive. A complete understanding would span multiple books and would exploit various features of the evolving HTTP protocol2 (e.g., caching, connection reuse, content encoding, cookies), aspects of TCP behavior (e.g., flow and congestion control handling, connection setup and teardown, TCP window size), as well as browser characteristics (including preference settings).
A crucial first step in web performance analysis is to understand how long downloading and rendering a URL takes. An excellent analysis is provided by the website http://webpagetest.org, which gives a detailed breakdown for each component and the overall response time for any website by simply providing its URL [5] . By default, this analysis is based on averaging data from 3 URL accesses, but can be changed as per users preference. Further, this analysis is stored in the history and can be accessed later as well, even after few months. As an example, the analysis for the website (http://acc.digital) hosting this journal article [6] is presented as a Waterfall model in Figure 2. Modern browsers such as Chrome, Firefox, Safari, Chrome also provides some form of waterfall model analysis. Details of carrying out such analysis in the Chrome locally via the Network tab under Developer Tools are available at [7].)
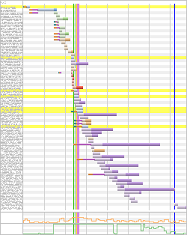
Figure 2: Waterfall model for http://acc.digital
Analysis of http://acc.digital shows that loading the website main page issues a total of 68 URL requests and makes 18 TCP connections. Based on the data provided in this analysis, a timeline of key events is presented in Figure 3.
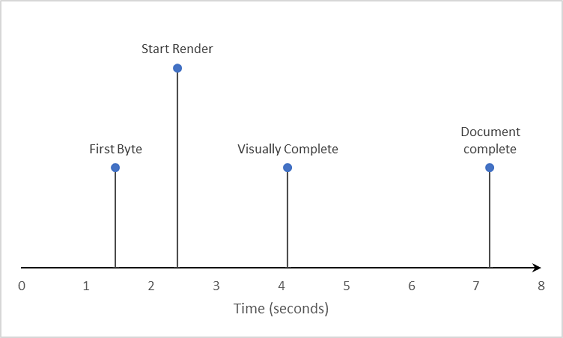
Figure 3: Timeline of events when accessing http://acc.digital
This analysis helps us understand exactly where time is being spent, and these parts can be the initial targets of optimization. For this website, the above analysis reveals that a substantial fraction of the overall time (from about 2.5s to about 7.0s) is due to images. Drilling more deeply, we find that across all three test accesses, URL request number 47 took about 4s to download 532KB and URL request number 62 took about 2.7s to download 252KB. These URLs correspond to large images from a third-party domain (not belonging to acc.digital). By optimizing the time for downloading these resources, the overall web page response time can clearly be improved.
Another interesting implication of this analysis is evident by carefully examining the bandwidth analysis in the Connection View (see Figure 4).
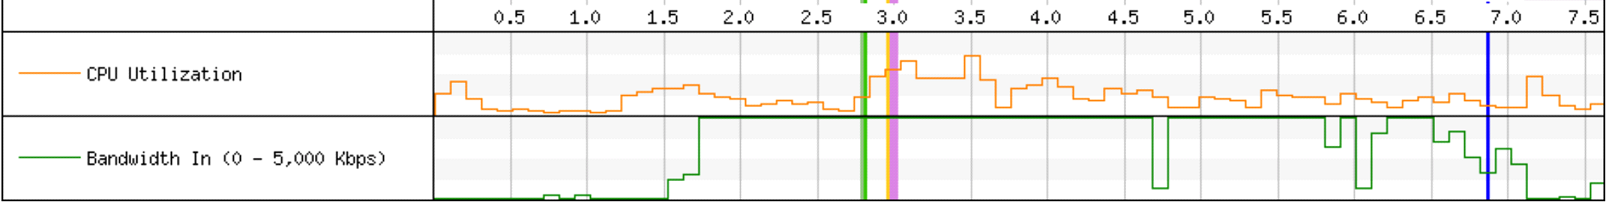
Figure 4: Connection View – Bandwidth utilization
This analysis reveals that for the initial 1.6s, the available bandwidth (5Mbps) was not being used at all, whereas from 1.6s to 6.0s it was almost fully used, from 6.0s to 6.6s it was about 50% used, and lastly from 6.6s to 7.5s it was once again nearly unused. This indicates that increasing bandwidth (e.g., to 10Mbps) would have essentially no impact during first 1.6s and the last 0.9s. In other words, about one third of the total time is agnostic to the bandwidth of the internet connection. This is consistent with the findings of a study by Belshe [8], which showed that increasing the bandwidth of a network connection is far less likely to significantly improve web performance compared with decreasing network latency. The latter improvement brings near linear improvement in PLT (i.e., PLT decreases linearly with decrease in latency), whereas improving bandwidth beyond 3Mbps has very little impact on improving PLT for typical pages.
Experiment 1: Analyzing web performance
Analyze the performance of a web page of interest to you with http://webpagetest.org and identify opportunities for optimizing specific components for better web performance. As an added exercise, drill deeper into the overall and component-wise analysis as we have illustrated.
Web performance improvement is not limited to lowering the time for downloading and rendering contents – it involves several other techniques including HTTP protocol optimizations, wise utilization of TCP connections (e.g., using multiple connections concurrently), browser performance optimizations, prioritizing URL fetching, caching, speculative optimization (e.g. pre-fetching, DNS pre-resolutions), network optimizations, content compression etc. Steve Souders has attempted to summarize the key techniques into 14 rules to help improve web performance [9] (with additional detailed explanations posted in Yahoo Developer Network forums [10]). We discussed some of these techniques (e.g., persistent HTTP connections, concurrent connections, caching, partial content delivery using chunked transfer encoding) in our previous article [11]. We discuss a few more of these techniques as well as others in the subsequent sections.
As we have seen, modern web pages typically contain several other URLs, and many of these refer to other host/domain names. The key idea of prefetching is that instead of waiting for the user to click on some of these links, the browser pre-resolves these host/domain names to IP addresses using DNS. For even better performance, it can establish TCP connections and even pre-fetch contents from these URLs. Thus, by the time the user clicks on such a link, the content is already available in the browser cache and can be served instantly, resulting in a very satisfactory user experience. Naturally, if the user does not click these links, prefetching becomes a wasted effort.
In the Chrome browser, prefetching can be enabled via the Privacy and Security tab under Advanced Settings, as shown in Figure 5.
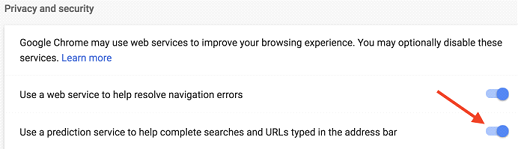
Figure 5 : Enabling prefetching in Chrome
As an exercise, the reader is encouraged to examine and analyse the web traffic (e.g., using Wireshark ,[7]) for evidence of prefetching while accessing a chosen website. Note that such predictive behaviour is browser dependent, and one may not always see the prefetched contents.
As described above, prefetching is enabled by the user’s browser setting. The web application developer can also enforce prefetching via the web-page contents. As an example, the URLs http://www.rprustagi.com/index.html and http://www.rprustagi.com/accs/prefetch.html [10] differ only in text highlighted in bold font in Table 2.
Table : HTML content to ensure prefetch (changes in bold font)
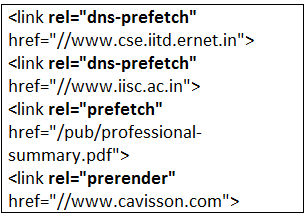
The two pages are visually identical – the difference between them lies in subsequent navigation. Clicking on any of the links will provide better user experience for the latter page. The first two changes inform the browser to pre-resolve the DNS names for www.iisc.ac.in and www.cse.iitd.ernet.in. The next change asks the browser to prefetch the PDF file and store it in the browser cache. The final change not only asks to prefetch the contents, but to prerender it in the browser’s memory. The impact of DNS pre-resolution may be imperceptible in its improved performance, but it does help.
Experiment 2: Prefetching contents
Develop a web page that incorporates the HTML tag and the attribute “rel” with various prefetch values. Analyze the web traffic using Wireshark capture and verify the impact on web performance with and without prefetch.
Web-pages for highly interactive websites (e.g., e-commerce websites) include several images. Many of these are small images used to create aesthetic navigation menu icons. In a naïve design, each of these images would be separate files that would be downloaded individually. While each file is individually small, the latency for initiating each download plays a significant role contributing to overall performance delay of the web-page. The key idea of an image sprite is to combine multiple (say N) images into a single image, replacing the latency of N HTTP requests with the latency of a single HTTP request. The image sprite is logically divided into multiple parts, each of which is identified by specifying its location coordinates and size. Taking the examples of 9 images from the HTTP Persistent Connection exercise described in [11], we create a single image by combining these 9 images into the sprite as shown in Figure 6.
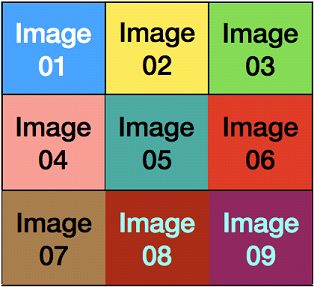
Figure 6: An image sprite consisting of 9 images
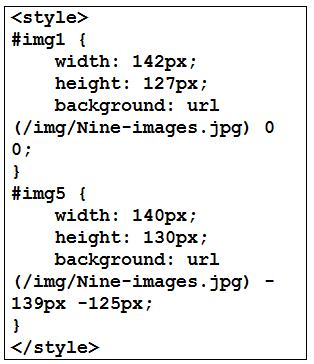
CSS stylesheets can now be used to extract individual portions of the sprite for separate display as needed. The trick is to define the main source for each image as a transparent empty image (of size of 1 pixel) using the src attribute of the HTML tag, and specifying the sprite image as a background image. The starting coordinates of each image within the sprite as well as its size (i.e., its height and width in pixels) together with an identifier is specified in the style sheet, as shown in Table 3.
Table 3 : Style sheet specifying individual images.
Finally, the web page uses these identifiers in HTML tags to render specific segments of the sprite, as shown in Table 4.
Table 4: Web page content using image sprites
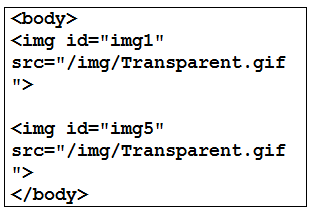
The code in Table 4 is used in the URL http://rprustagi.com/accs/sprite.htm, and is rendered as expected by the browser as shown in Figure 7.
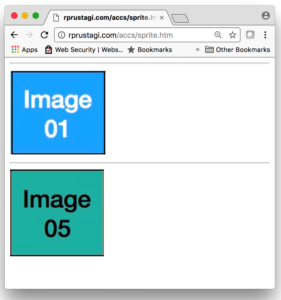
Figure : A web-page displaying only two images.
Experiment 3: Image Sprites
As an exercise, the reader should develop a web page with multiple images and compare the web performance for two versions of the site: with each image in an individual file, and with all images combined into a single sprite.
[2] HTTP has evolved from the initial version 0.9(unofficial) to 1.0, and to HTTP-1.1 (The default version today). The most recent version (called HTTP/2) includes additional features, but we will not discuss these in this article.
A web browser makes a limited number of concurrent connections to a hostname. For example, the Firefox browser by default makes at most 6 connections to a single hostname. Domain sharding attempts to overcome this limitation by logically dividing the URLs of a website domain (e.g., example.com) into multiple subdomains (e.g. sales.example.com, engineering.example.com, etc.) These subdomains can be hosted on the same web server or on multiple web servers. If we assume that a browser can make only 6 concurrent connections to one hostname, the webpage can contain multiple embedded URLs from (say) 3 subdomains. Now, the browser can make 3 X 6 = 18 concurrent TCP connections instead of just 6, thereby increasing concurrency.
Experiment 4: Domain Sharding.
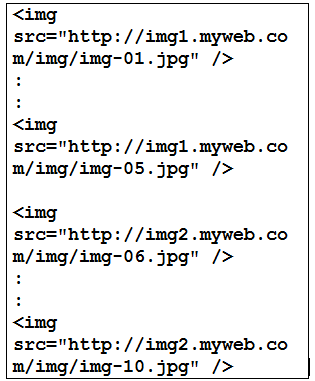
To experience use of domain sharding, consider the web page pictures.html with 10 images as described in [11]. Cluster the first 5 images in one subdomain (e.g., img1.myweb.com) and the remaining 5 images in another subdomain (e.g., img2.myweb.com). Make the changes to the web page as shown in Table 5. To access these hostnames, either update your DNS server to resolve these names or, more simply, make entries for img1.myweb.com and img2.myweb.com in the /etc/hosts file on the machine where the browser is running to overcome the DNS resolution issues. Experimentally determine whether domain sharding improves the web performance.
Table 5: Embedded objects with Domain Sharding
If a website contains multiple small images that cannot be easily agglomerated into sprites (e.g., because they are not rectilinear), the latency delay associated with multiple HTTP requests for individual files can be reduced by in-lining these resources directly into the HTML page, without any external references. The format for resource in-lining is:
data: [mediatype] [;base64] , data
where mediatype could be image/jpg or any other MIME type. An example is available at the web page http://rprustagi.com/accs/r-inline.htm. It should be noted that Base64 encoding (which uses A..Za..z0..9+/ as the character set to encode 6 bits of original data) increases the data size by 33%. Thus, as the size of images increases, one needs to make a judgmental call whether the improved latency of inlining is offset by the increased download time (and overall size) of the web-page.
Experiment 5: Resource in-lining of images
To develop a better understanding and experience the resource inline concept, the reader is encouraged to create a web-page with multiple small images. Encode each image into Base64 format (using the Linux command base64) and incorporate the encoded content into the HTML page. Experimentally determine whether inlining improves web-performance.
A growing fraction of users access the internet on mobile devices. These have low bandwidth connectivity at times, and hence download times play a significant role in web performance for mobile users. To save on download time, content can be compressed before being sent to the end user device (where it must be decompressed before it can be rendered3). This requires HTTP requests to contain information on what kind(s) of compression the user device can support. For example, sending the HTTP header “Accept-Encoding: gzip” in the request implies that user device can understand gzip compression. If the web server supports gzip compression, it will send compressed content, and the compression ratio will dictate improved download times. If a user device supports multiple compression methods, it can specify all such methods separated by comma character e.g. “Accept-Encoding: gzip, deflate, bzip2” etc. The order also specifies the preference, and the web server will use the supported compression method in this preference order.
Experiment 6: Compression as per user device and bandwidth.
Use wget command with its command line option to specify desired header (by default, wget does not send any compression preference). Use wget with the option –-header=”Accept-Encoding: gzip” with your preferred website and note down the size received, and then invoke the same request without this header option and note down the size received and then you can note the difference in download size. For example, invoking ‘wget -d –no-check-certificate -O /tmp/index.html https://www.google.co.in’ will get the content from Google without compression and invocation of ‘wget -d –no-check-certificate –header=”Accept-Encoding: gzip, deflate” -O /tmp/index.html.gz https://www.google.co.in’ will get the content with compression. The former is likely show received data size about 15K (‘/tmp/xyz.html’ saved [14724]), and the latter is likely show received data size about 5K (‘/tmp/xyz.gz’ saved [5496/5496]). Please note that not every website may support compression, and thus when the website does not support compression, it will send the result uncompress e.g. author’s website (rprustagi.com) does not support compression.
The default web protocol being used today in the Internet is HTTP/1.1. We have discussed some of the key mechanisms that are used in this protocol, but performance optimization is not limited only to optimizing protocol performance. A detailed analysis would also consider all other layers of the networking stack. At the physical and link layers, one needs to consider issues such as bandwidth and latency, beacon management and frame conflicts in WiFi, etc. HTTPS requests constitute 59% of web requests (Table 1), and thus one needs to consider optimizations at the Transport Layer Security (TLS) level as well. Similarly, at the transport layer, TCP level optimizations would require explicit understanding of three-way handshake, slow start, congestion and flow control mechanisms and their impact on throughput.
The new version HTTP/2 [16] of the web protocol was standardized in 2015, with the key design goal to make web applications faster. It does away with some of the workarounds used in HTTP/1.1 and introduces new mechanisms such as server-side push, stream support, minimization of HTTP header communication, compression at the HTTP header level, while also addressing head of line blocking. We will examine this protocol in one of our subsequent articles.
[3]Note that this imposes an additional computational burden on the mobile device, where battery life is also a limiting factor.
[1] HTTP Trends, http://www.httparchive.org/trends.php, last accessed Feb 13, 2018
[2] Ilya Grigorik, “High Performance Browser Networking, Chapter 10”, O’Reilly, 2014. http://hpbn.co last accessed on Jan 31, 2018
[3] Web Performance Optimization Statistics, https://wpostats.com, last accessed Feb 12, 2018.
[4] Measure Performance with RAIL Model, https://developers.google.com/web/fundamentals/performance/rail, last accessed Feb 10, 2018
[5] http://webpagetest.org, last accessed on Feb 13, 2018
[6] Advanced Communications and Computing, http://acc.digital/, last accessed on Feb 13, 2018
[7] https://developers.google.com/web/tools/chrome-devtools/network-performance/
[8] Mike Belshe, “More Bandwidth does not Matter”, http://www.belshe.com/2010/05/24/more-bandwidth-doesnt-matter-much/, last accessed Feb 14, 2018.
[9] Steve Souders, “Rules for Faster Loading Websites”, http://stevesouders.com/hpws/rules.php.
[10] Yahoo Developer Network, “Best Practices for Speeding up Your website”, https://developer.yahoo.com/performance/rules.html
[11] Ram Rustagi, Viraj Kumar, “HTTP Protocol Mechanisms for High Performance Applications”, ACCS Journal on Communications and Computing, Sep 2017. http://acc.digital.com/
[12] Wireshark: https://www.wireshark.org, Last accessed 2017-11-30.
[13] Ram Rustagi, “Web pages with performance improvement examples for ACCS:”, http://www.rprustagi.com/accs/ , last accessed Feb 15, 2018
[14] RFC 1945, “Hyper Text Transfer Protocol – HTTP/1.0”, Network Working Group, Informational, Berners-Lee(MIT), Fielding (UC Irvine), Frystyk(MIT), May 1996.
[15] RFC 2616, “Hyper Text Transfer Protocol – HTTP/1.1”, Network Working Group, Request for Comments 2616. Fielding (UC Irvine), Gettys (Compaq), Mogul (Compaq), Frystyk(MIT), Masinter (Xerox), Leach (Microsoft), Berners-Lee(MIT), June 1999
[16] RFC 7540., “Hypertext Transfer Protocol Version 2 (HTTP/2)”, IETF, Proposed Standard, Belshe (Bitgo), Peon (Google), Thmoson (Mozilla), May 2015
[17] Example web pages and scripts. https://github.com/rprustagi/EL-Web-Performance-I.git.